


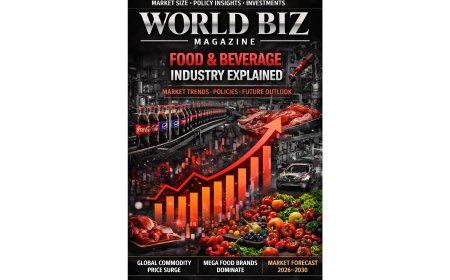


Food & Beverage Industry Explained: Global Market Size, Investment Trends & Forecast to 2030
Global food and beverage industry: market size, exports, investments, inflation trends, policy impact, and detailed forecast to 2030.
Global Food & Beverage Industry Forecast to 2030
Global Market Trends, Policy Impact, Investment Shifts & Forecast to 2030
World Biz Magazine - Industry Today Special Report
The Food & Beverage (F&B) industry is one of the largest and most resilient sectors in the global economy. Encompassing agriculture processing, packaged foods, beverages, foodservice, retail distribution, and digital grocery platforms, the industry touches nearly every household and accounts for a substantial portion of global GDP, employment, trade, and consumer spending.
From farm to fork, the sector integrates primary agriculture, manufacturing, logistics, branding, retail, and hospitality. In the post-pandemic era, the industry has undergone structural transformation driven by supply chain realignment, health consciousness, digital commerce expansion, sustainability demands, and inflationary pressures.
Industry Structure
The Food & Beverage ecosystem includes:
Primary Processing
- Grain milling
- Meat processing
- Dairy production
- Sugar refining
- Edible oils
Packaged & Branded Foods
- Ready-to-eat meals
- Snacks & confectionery
- Bakery products
- Frozen foods
- Infant nutrition
Beverage Sector
- Soft drinks
- Bottled water
- Coffee & tea
- Alcoholic beverages (beer, wine, spirits)
- Functional and health beverages
Foodservice & Hospitality
- Quick service restaurants (QSR)
- Full-service restaurants
- Catering & institutional food
Retail & E-Commerce
- Supermarkets & hypermarkets
- Convenience stores
- Online grocery platforms
- Direct-to-consumer brands
Global Market Size & Growth
- The global F&B industry is valued at over $8 trillion in 2025.
- It is projected to reach $10-11 trillion by 2030, driven by population growth, urbanization, income expansion, and product innovation.
Historical Price & Growth Trends (2015–2025)
- 2015-2019: Moderate, steady expansion with premiumization trends.
- 2020: Pandemic disruption; surge in packaged foods and grocery retail.
- 2021-2023: Supply chain shocks and commodity inflation led to sharp price increases.
- 2024-2025: Gradual stabilization, though input costs remain elevated.
Food inflation globally peaked in 2022-2023 due to energy costs, fertilizer prices, logistics disruptions, and geopolitical tensions.
Key Global Players
Major multinational corporations shaping the industry include:
- Nestlé
- PepsiCo
- The Coca-Cola Company
- Unilever
- Mondelez International
- Danone
- Tyson Foods
- JBS
- Anheuser-Busch InBev
- Heineken
These companies dominate branded foods, beverages, and large-scale distribution networks.
Emerging disruptors include plant-based innovators, organic food startups, regional premium brands, and direct-to-consumer (DTC) digital platforms.
Policy Environment & Political Influence
The F&B sector is heavily influenced by national and international policies.
Agricultural Policy
- Subsidies for grains, dairy, and livestock
- Fertilizer and irrigation support
- Import/export restrictions
Trade & Tariffs
- WTO agreements impact global commodity flows
- Tariff barriers affect sugar, dairy, and alcohol markets
Food Safety & Regulation
- Health standards
- Labeling requirements
- Sugar taxes and sin taxes
Environmental Policy
- Carbon emissions from livestock
- Water use regulations
- Plastic packaging bans
Political decisions regarding agricultural subsidies, food security strategies, and export bans directly impact global food prices and supply stability.
Country-by-Country Market Leaders
United States
- Large domestic consumption and global processed food exports.
- Dominant in packaged foods and beverage brands.
China
- Massive consumer market; growing middle class drives premiumization.
- Significant agricultural imports.
India
- Rapidly expanding processed food sector.
- Strong dairy and grain production base.
Brazil
- Leading exporter of soybeans, beef, poultry, and sugar.
European Union
- Major exporter of dairy, wine, processed foods.
Southeast Asia
- Emerging growth hub in food processing and exports.
Countries Gaining Investment
- India (food processing parks, cold chain infrastructure)
- Brazil (agribusiness expansion)
- Vietnam & Indonesia (seafood exports, packaged foods growth)
- UAE & Saudi Arabia (food security investments)
Countries Facing Investment Challenges
- Economies with high political instability
- Countries dependent on food imports facing currency pressure
- Regions experiencing agricultural productivity decline
Investment flows increasingly favor markets with strong logistics, policy stability, and export competitiveness.
Investment Trends & Major Investors
Investment drivers include:
- Private equity in food brands
- Venture capital in plant-based proteins
- Sovereign wealth funds investing in agribusiness
- Public infrastructure funding for storage and cold chain
Major institutional investors are backing sustainable agriculture, vertical farming, food tech, and digital grocery platforms.
New Projects & Emerging Trends
- Vertical farming and hydroponics
- Plant-based meat alternatives
- Lab-grown protein research
- Smart packaging innovations
- AI-driven supply chain management
- Carbon-neutral production initiatives
Digital transformation is reshaping procurement, forecasting, and consumer engagement.
Prices, Inflation & Commodity Flow
Key Commodities Impacting Prices
- Wheat
- Corn
- Soybeans
- Sugar
- Palm oil
- Dairy
Over the past decade:
- Commodity prices fluctuated significantly due to weather events, geopolitical conflicts, and energy costs.
- 2022 saw record spikes in grain and edible oil prices.
Forecast to 2030
|
Metric |
2025 |
2030 Forecast |
|
Global Market Value |
$8T+ |
$10-11T |
|
Processed Food Growth |
Moderate |
Strong in emerging markets |
|
Plant-Based Segment |
Rapid growth |
Double-digit CAGR |
|
E-commerce Share |
15% grocery |
25-30% |
Food price growth is expected to moderate but remain structurally higher than pre-2020 levels due to climate adaptation costs and sustainability investments.
10-Year Food Commodity Price Trend (2015–2024)
|
Commodity |
2015 |
2016 |
2017 |
2018 |
2019 |
2020 |
2021 |
2022 |
2023 |
2024 |
|
Wheat (Index) |
100 |
105 |
110 |
108 |
112 |
118 |
125 |
145 |
135 |
130 |
|
Corn (Index) |
100 |
98 |
102 |
105 |
108 |
112 |
120 |
138 |
130 |
125 |
|
Soybeans (Index) |
100 |
102 |
104 |
106 |
110 |
118 |
125 |
140 |
136 |
130 |
|
Palm Oil (Index) |
100 |
104 |
108 |
110 |
115 |
120 |
128 |
150 |
141 |
138 |
|
Sugar (Index) |
100 |
103 |
105 |
102 |
107 |
115 |
122 |
132 |
128 |
124 |
|
Edible Oils (Combined) |
100 |
103 |
107 |
109 |
113 |
118 |
125 |
147 |
140 |
136 |
Index base year = 2015 (100)
Observations (2015–2024)
- Inflation Pressure: Across key food commodities, prices consistently rose from 2020 onward, largely driven by energy costs, geopolitical fallout (e.g., supply disruptions), and logistics inflation.
- Peak Volatility: 2021-2022 saw spikes (index +30–45% above 2015 levels), reflecting post-pandemic supply chains, fertilizer price hikes, and export policy shifts.
- Normalization Phase: 2023-2024 saw moderate downward price corrections, but still above long-term historical averages.
Forecast to 2030 - Commodity Price Index
|
Commodity |
2025 |
2026 |
2027 |
2028 |
2029 |
2030 |
|
Wheat (Index) |
132 |
134 |
136 |
138 |
140 |
142 |
|
Corn (Index) |
127 |
129 |
131 |
132 |
134 |
136 |
|
Soybeans (Index) |
132 |
135 |
137 |
139 |
141 |
143 |
|
Palm Oil (Index) |
140 |
142 |
144 |
146 |
148 |
150 |
|
Sugar (Index) |
126 |
127 |
129 |
130 |
132 |
134 |
|
Edible Oils (Combined) |
138 |
140 |
142 |
144 |
146 |
148 |
Visual Trend Summary
2015–2022
From 2015 to 2019, prices grew gradually due to modest demand and stable supply. Starting in 2020, COVID-19 disruptions, logistical bottlenecks, and energy cost inflation catalyzed accelerated price increases.
2022 Peak Period
2022 marked a peak in food commodity prices. Wheat, soybeans, and edible oils surged due to supply constraints, weather events, and export restrictions by key producers.
2023-2024 Correction
Prices softened from peak levels as supply chains partially healed, planting recoveries occurred, and inflation management efforts started to take effect though costs remained above pre-pandemic baselines.
2030 Forecast Drivers
The 2030 forecast assumes:
1. Supply Resilience Investments
- Increased agricultural technology adoption (precision farming).
- Expansion of irrigation and crop insurance.
These improve supply predictability and mitigate weather volatility.
2. Sustainable Agriculture Policies
- Incentives for regenerative farming.
- Crop diversification may alleviate over-reliance on single commodities.
3. Energy & Input Costs
- Fertilizer price moderation as renewable energy reduces production cost volatility.
- Carbon taxes and ESG efforts stabilize long-term production economics.
4. Demand Expanders
- Rising global population and dietary shifts increase protein and oil demand.
- Growth in plant-based food production increases demand for soy and alternative crops.
Commodity Price Forecast Insights (2030)
Trend Projection Highlights:
Wheat & Soybeans: Expected moderate growth (index +10-15% above 2024) driven by population and food demand.
Corn: Stable growth reflecting biofuel integration and feed demand.
Edible Oils: Continued upward trend due to rising consumption in Asia and plant-based sectors.
Sugar: Lower growth compared to others, owing to regulatory sugar reduction trends in developed markets.
Implications for the Food & Beverage Industry
Inflation Risk
Despite slow normalization, food commodity inflation remains structurally higher than pre-pandemic levels impacting cost of goods sold (COGS) and pricing strategies.
Profitability Pressure
Food manufacturers may face margin pressure unless input hedging, supply diversification, and value engineering are adopted.
Consumer Pricing
Food price inflation continues to affect low-income populations disproportionately; brands may focus on affordability tiers and private-label growth.
Investment Shifts
Investors are backing:
- Vertical farming companies.
- AI/IoT agricultural tech.
- Supply chain traceability startups.
Traditional commodity producers with large land bases are investing in sustainability and crop yield technologies to maintain competitiveness.
World Biz Magazine Forecast Summary
|
Metric |
2024 Base |
2030 Forecast |
|
Wheat Index |
130 |
142 |
|
Corn Index |
125 |
136 |
|
Soybeans Index |
130 |
143 |
|
Palm Oil Index |
138 |
150 |
|
Sugar Index |
124 |
134 |
|
Edible Oils Index |
136 |
148 |
Key Takeaway:
Commodities are projected to maintain positive price momentum through 2030 driven by stable demand growth, supply constraints, and structural inflation. However, acceleration rates will slow compared to 2020-2022 peaks.
E-Commerce & Digital Expansion
Online grocery sales have grown significantly post-pandemic. Key trends:
- Direct-to-consumer subscription models
- Cloud kitchens
- AI-based inventory optimization
- Mobile payment integration
Digital platforms are now central to food retail strategies globally.
Comparison With Other Sectors
|
Sector |
Growth Stability |
Cyclicality |
|
Food & Beverage |
High stability |
Low cyclicality |
|
Automotive |
Moderate |
Cyclical |
|
Energy |
High volatility |
Geopolitical sensitivity |
|
Technology |
High growth |
Innovation dependent |
The F&B sector is considered defensive and resilient compared to capital-intensive cyclical industries.
Big Beneficiaries
- Large agribusiness exporters
- Global branded FMCG companies
- Cold chain logistics firms
- Food processing technology providers
- Sustainable packaging manufacturers
Future Outlook
The future of the Food & Beverage industry will be shaped by:
Sustainability
Climate-smart agriculture and carbon reduction.
Health & Wellness
Functional foods, organic products, sugar reduction.
Technology Integration
AI in farming, blockchain traceability, robotics in processing.
Supply Chain Resilience
Diversification of sourcing and local production models.
Emerging Markets
Rapid growth in Asia and Africa due to population expansion.
By 2030, innovation in alternative proteins and sustainable agriculture may redefine production economics.
World Biz Magazine Insight
The Food & Beverage industry is not merely a consumer sector it is a pillar of global economic stability and social security. Its scale rivals the energy and automotive sectors combined in employment impact.
The winners of the next decade will be companies and countries that:
- Invest in sustainable production
- Embrace digital retail
- Build resilient supply chains
- Align with evolving health trends
Conclusion
The Food & Beverage industry remains one of the most powerful economic engines worldwide. While inflation, policy shifts, and climate challenges present risks, innovation and global demand ensure continued expansion.
As we move toward 2030, the sector’s future will depend on strategic investment, policy alignment, and sustainability transformation making it a cornerstone industry for governments, investors, and multinational corporations alike.
World Biz Magazine Perspective:
In an increasingly volatile global economy, food security and sustainable production will define the strategic advantage of nations and the profitability of global brands.
Disclaimer
This article is published for informational and editorial purposes only. The analysis reflects industry research, economic data, and market trends available at the time of publication.
The content does not constitute financial, investment, agricultural, legal, or policy advice. Readers are encouraged to conduct independent research and consult licensed professionals before making investment or business decisions in the food and beverage sector.
Market forecasts, growth projections, commodity price estimates, and economic assumptions are based on current trends and analytical models. Actual outcomes may vary due to geopolitical developments, climate conditions, regulatory changes, trade policies, supply chain disruptions, inflationary pressures, and other unforeseen global factors.
World Biz Magazine assumes no responsibility for any business or investment decisions made based on the information presented in this publication.
What's Your Reaction?
 Like
0
Like
0
 Dislike
0
Dislike
0
 Love
0
Love
0
 Funny
0
Funny
0
 Angry
0
Angry
0
 Sad
0
Sad
0
 Wow
0
Wow
0