


Global Oil and Gas Industry Analysis 2026–2030 | World Biz Magazine
World Biz Magazine deep dive into global oil markets, investments, exports, and future energy shifts.

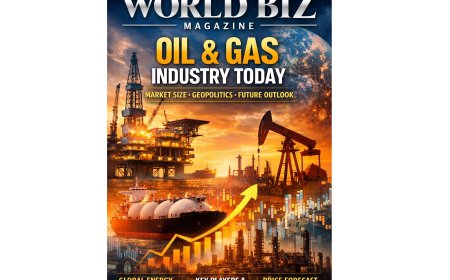
Oil & Gas Industry Today
Market Dynamics, Geopolitics, Investments, and the Road Ahead
World Biz Magazine - Industry Intelligence Feature
The oil and gas sector remains one of the most strategically important industries shaping global economics, geopolitics, and energy security. Despite accelerating energy-transition efforts, hydrocarbons continue to power industrial activity, transportation, electricity generation, and petrochemicals.
The global market was valued at roughly $6.10 trillion in 2024 and expanded to about $6.33 trillion in 2025, with long-term forecasts pointing toward nearly $8.79 trillion by 2034 (3.7% CAGR).
Another analysis estimates the market around $8.36 trillion in 2026 and potentially $15.2 trillion by 2035, reflecting strong demand growth and inflation-linked price expansion.
Asia-Pacific currently leads consumption and revenue share, accounting for over 36-37% of the market, driven by industrialization and population growth.
Meanwhile, the upstream exploration & production segment alone reached about $4.2 trillion in 2025, with over 93,000 businesses worldwide, highlighting the sector’s vast industrial footprint.
Industry Structure & Key Segments
The industry is traditionally divided into three operational tiers:
- Upstream (40%) - exploration and production
- Midstream (30%) - transport and storage
- Downstream (30%) - refining and distribution
Technological sub-sectors such as automation are rapidly expanding, with digital oilfield and AI-enabled monitoring markets expected to grow from $20.86B (2024) to $32.08B by 2030.
Key Industry Players
Major multinational operators dominating production and investment include:
- Saudi Aramco
- Shell
- ExxonMobil
- BP
- ADNOC
These firms control large market shares through integrated upstream downstream portfolios and strategic partnerships. The top five companies together hold about 60% of total industry share.
Key Industry Contracts & Value Chains
Typical contracts shaping industry economics include:
- Exploration licensing agreements
- Production-sharing contracts (PSC)
- LNG supply contracts
- Infrastructure EPC deals
- Strategic M&A transactions (75% of energy deal value in early 2025)
These arrangements determine global investment flows, pricing risk, and geopolitical leverage.
Market Size by Region & Production Influence
Leading Production / Export Powers
- Middle East - reserve-heavy exporters dominating supply
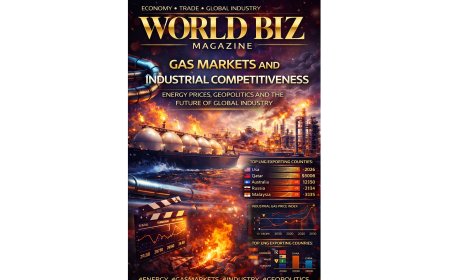
- United States - major natural gas and LNG exporter; produces 25.5% of global gas output
- Russia - major exporter impacted by sanctions
- Norway - key supplier providing about 30% of Europe’s gas needs
Sanctions and policy decisions strongly affect market dynamics. For example:
- Russian energy revenues dropped sharply due to restrictions, falling from $14.5B to $5.1B monthly revenue in one year.
Political Influence & Policy Effects
Energy policy shapes macroeconomic stability and national strategy.
Economic Dependency
Oil revenues underpin national budgets in many economies - Oman’s fiscal deficit surged when prices collapsed in 2014-2016, forcing subsidy cuts and diversification reforms.
Geopolitical Tools
Policies like export restrictions or price caps can reduce producer GDP by billions annually, redistributing wealth toward importers.
Diversification Initiatives
Gulf states are investing in knowledge economies and social infrastructure to reduce oil dependency.
Industrial Policy Example
Saudi localization programs tied to oil operations generated $280B GDP contribution and 200k jobs, demonstrating sector-driven industrial transformation.
Investments & Exploration Trends
- Norway’s investment cycle peaked recently, with spending forecast to fall after major developments conclude.
- Equinor plans production expansion through Brazil, U.S., UK, and Canada projects targeting hundreds of thousands of barrels/day.
- Exploration frontiers include:
- Brazil offshore
- Namibia
- Eastern Mediterranean
- Angola
These reflect continued capital commitment despite transition narratives.
Technological Evolution
The shale revolution transformed production economics through:
- Horizontal drilling
- Hydraulic fracturing
- Real-time analytics
These methods boosted U.S. output dramatically and cut drilling costs by half over a decade.
Digitalization and automation are now key competitive differentiators.
Global Pricing, Inflation & Historical Trends
Last Decade Dynamics
- Oil prices collapsed from above $110 (2014) to below $30 (2016)
- Triggered fiscal crises in producer economies
Structural Drivers
- Supply expansion from shale
- Geopolitical disruptions
- Inventory fluctuations causing volatility
Forward Outlook
Abundant supply and technological efficiencies may keep prices relatively moderated long-term despite rising demand.
Countries Facing Reserve Decline or Pressure
While exact depletion lists vary, pressure categories include:
- Mature North Sea producers with falling investment cycles
- Economies forced to diversify due to volatility (e.g., Oman example)
- Sanction-constrained exporters experiencing revenue erosion
These trends signal gradual structural shifts in energy geopolitics.
Oil Dependency in Commerce & E-Commerce Ecosystems
Energy costs affect:
- Logistics and shipping
- Data center operations
- Manufacturing supply chains
Global digital infrastructure investments are tied to energy demand, with energy consumption expected to continue growing alongside digitalization.
Future Outlook
Key trajectories shaping the next decade:
Continued Demand
Oil and gas demand may continue rising through mid-century depending on policy scenarios.
Natural Gas Growth
Cleaner fuel positioning and LNG infrastructure expansion support growth.
Energy Transition
Investment is shifting toward:
- Renewables
- Critical minerals
- Electrification
But hydrocarbons remain central during transition decades.
Market Expansion
Long-term CAGR projections indicate steady but moderate growth across most forecasts.
Conclusion
The oil and gas industry continues to sit at the crossroads of economic power, technological innovation, and geopolitical strategy. While the world is gradually transitioning toward alternative energy sources and strategic metals, hydrocarbons remain indispensable to industrial civilization.
Key realities define the modern landscape:
- Massive capital scale and geopolitical leverage
- Ongoing technological transformation
- Persistent demand growth in emerging markets
- Increasing diversification pressures in producer economies
For investors, policymakers, and industry leaders, the future is not a simple decline narrative but rather a complex hybrid transition where oil and gas coexist with emerging energy ecosystems.
World Biz Magazine Insight:
The coming decade will likely see hydrocarbons evolve from dominant energy backbone to strategic bridge resource shaping global economics even as the energy mix diversifies.
Disclaimer
This article is intended for informational, research, and editorial purposes only. Market figures, forecasts, and industry insights are based on publicly available data, industry reports, and analytical interpretations at the time of writing. They should not be considered financial, investment, legal, or policy advice.
World Biz Magazine does not guarantee the accuracy or completeness of market projections or economic forecasts and assumes no liability for decisions made based on this content. Readers are encouraged to consult qualified professionals and official sources before making business or investment decisions.
All trademarks, company names, and industry references remain the property of their respective owners and are used strictly for journalistic and informational purposes.
What's Your Reaction?
 Like
0
Like
0
 Dislike
0
Dislike
0
 Love
0
Love
0
 Funny
0
Funny
0
 Angry
0
Angry
0
 Sad
0
Sad
0
 Wow
0
Wow
0